
Indicators
Indicators
Indicators
Profit Rise Wave Rider
Profit Rise Wave Rider
Profit Rise Wave Rider
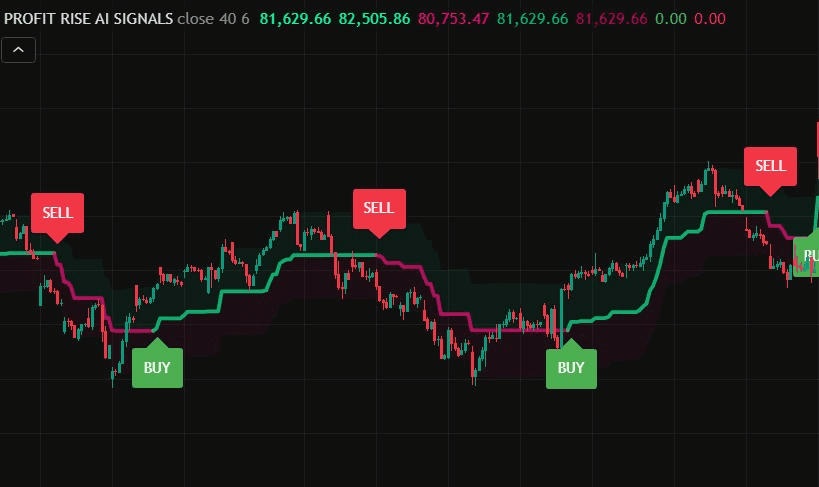
This is a stochastic-based momentum indicator designed to identify potential buy and sell signals in the stock market. It helps traders identify overbought and oversold conditions for potential trend reversals.
Key Features:
Customizable Inputs: Users can adjust Stochastic settings for better accuracy.
Buy & Sell Entry Lines: Marks levels for long (buy) and short (sell) trades.
Bar Color Change: Highlights different trade conditions (Green for buy, Red for sell, Blue for no trade).
Visual Trade Zones: Uses colored fills to differentiate between bullish, bearish, and neutral zones.
Smooth Stochastic Calculation: Reduces noise in the market signals.
Explanation of Components:
Stochastic Calculation:
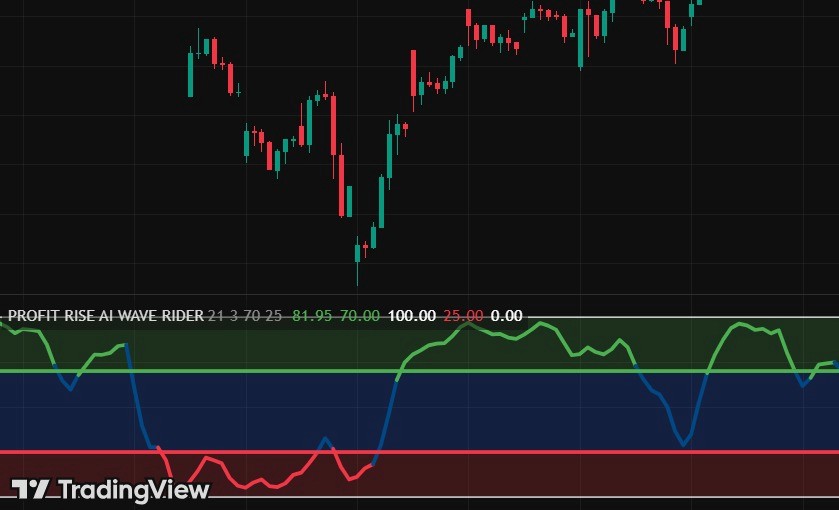
Uses length and smoothK values to calculate the stochastic oscillator. The K-line is the main indicator line showing momentum shifts.
Entry & Exit Lines:
Upper Line (ul): Default 70 – Buy exit or overbought region.
Lower Line (ll): Default 25 – Sell exit or oversold region.
Bar Colors:
Green: Buy trade (Stochastic crosses upper line).
Red: Sell trade (Stochastic crosses lower line).
Blue: No trade (Stochastic in neutral zone).
This is a stochastic-based momentum indicator designed to identify potential buy and sell signals in the stock market. It helps traders identify overbought and oversold conditions for potential trend reversals.
Key Features:
Customizable Inputs: Users can adjust Stochastic settings for better accuracy.
Buy & Sell Entry Lines: Marks levels for long (buy) and short (sell) trades.
Bar Color Change: Highlights different trade conditions (Green for buy, Red for sell, Blue for no trade).
Visual Trade Zones: Uses colored fills to differentiate between bullish, bearish, and neutral zones.
Smooth Stochastic Calculation: Reduces noise in the market signals.
Explanation of Components:
Stochastic Calculation:
Uses length and smoothK values to calculate the stochastic oscillator. The K-line is the main indicator line showing momentum shifts.
Entry & Exit Lines:
Upper Line (ul): Default 70 – Buy exit or overbought region.
Lower Line (ll): Default 25 – Sell exit or oversold region.
Bar Colors:
Green: Buy trade (Stochastic crosses upper line).
Red: Sell trade (Stochastic crosses lower line).
Blue: No trade (Stochastic in neutral zone).